
BioDiscovery, A Bionano Genomics Company software
CNVs from NGS
BioDiscovery - Algorithms Software for CNV and AOH Detection
BioDiscovery has developed two algorithms for the detection of CNV and AOH events from NGS using its decades-long expertise in the area. One algorithm, the “Self-reference” algorithm, can be used for all WGS data regardless of sequencing depth. The second is the “Multi-Scale Reference” (MSR) algorithm that is applicable to all NGS data (WGS, WES, and Gene panels). The MSR algorithm is able to create “virtual” bins with sizes proportional to the expected number of reads offering high-resolution detection of events in areas of interest (e.g. exons) while also providing a nice genome-wide backbone.
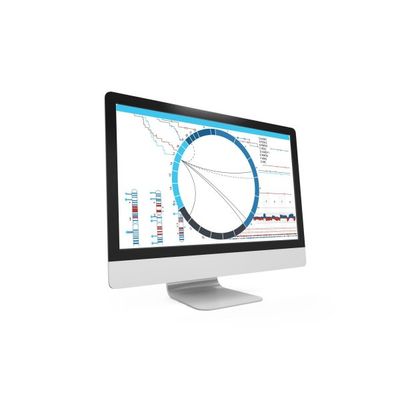
BioDiscovery - Whole Genome Sequencing Tools
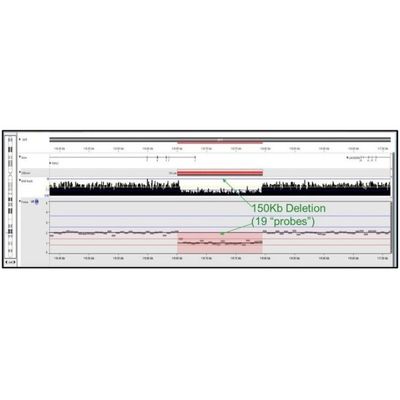
As described in Chaubey et al., Journal of Molecular Diagnostics, vol. 22, No. 6 June 2020, they used 10x WGS and validated that the NxClinical algorithm detected all CNVs and AOH that were found by high-resolution SNP arrays. Figure 2. shows a small exonic deletion detected using 10x WGS with the MSR algorithm. With higher depth NGS, smaller CNVs can be detected and integrated with sequence variants to provide a holistic view of the sample. In Figure 3., the ideogram shows regions of copy number gain (blue bars), loss (red bars), AOH (yellow shading), Allelic Imbalance (purple shading), as well as various types of Sequence Variants (e.g., SNV, In/Del, etc.) as colored “lollipops”.
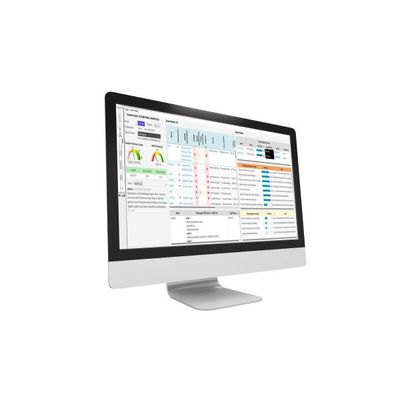
BioDiscovery - Gene Panels
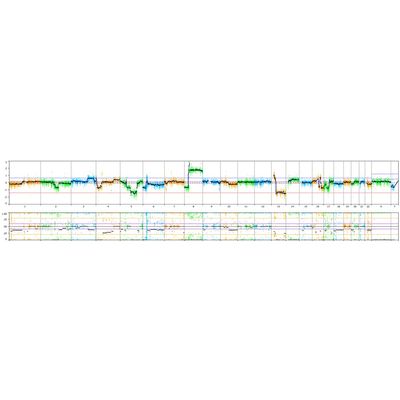
The MSR algorithm can be applied to any gene panel from single gene (e.g. DMD test) to large panels having thousands of gene. The image below is from the Illumina TruSightTM Oncology 500 (TSO500) panel showing a somatic cancer profile. The cytogenetic complexity of the tumor sample is clearly evident with a large copy number gain of 8p and loss of a large section of 13q. Aberrations associated with genomic scarring, such as Loss of Heterozygosity (LOH), telomeric allelic imbalances (TAI), and large-scale state transitions (LST) can be visualized and manually called with confidence.
ACMG Scoreboard
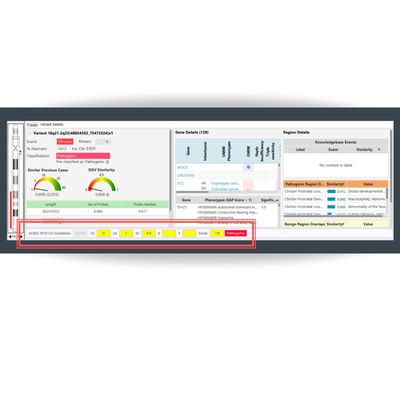
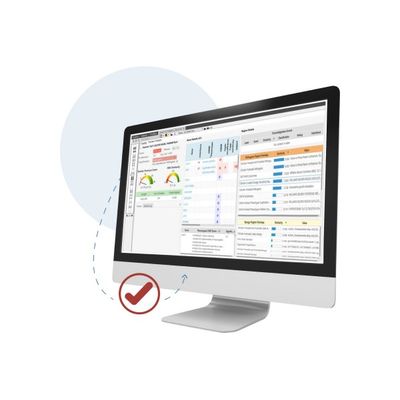
BioDiscovery - Model ACMG - Scoreboard Software
The most recent version of NxClinical, the leading copy number variation (CNV) analysis software for clinical cytogenetics and molecular labs, now includes an integrated ACMG guidelines scoreboard feature.
Others
BioDiscovery - User-friendly and Powerful Statistical Tools for Nexus Copy Number
Arming researchers with advanced genomic data analysis and visualization tools. Easy-to-use software provides cutting-edge statistical tools to advance scientific discovery.
BioDiscovery NxClinical - Comprehensive and Up-to-date Solution for Cytogenetics and Molecular Genetics
The most comprehensive and up-to-date solution for cytogenetics and molecular genetics in one system for analysis and interpretation of all genomic variants from microarray and NGS data.