

- Home
- Companies
- Kowa American Corporation
- Products
- Kowa - Model AP-7000 - Automatic ...
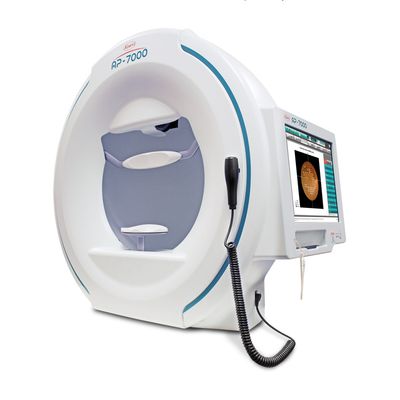
Kowa - Model AP-7000 -Automatic Perimeter
Kowa`s extensive normative database considers both the central field and the periphery thus ensuring consistent, accurate assessments when using a Kowa AP-7000 perimeter. Full threshold modes offer macular, central, and peripheral coverage up to 80°, while screening modes provide swift evaluation of the visual field. To shorten test times, quick modes are available for both threshold and screening modes. Static perimetry can be linked with fundus images from cameras, OCT, and SLO to define specific test locations on the retina. With its ergonomic, compact design, the AP-7000 offers additional comfort to patients, easy operation for the clinician, and fits perfectly within the practice.
Database of Normal Eyes
Normative database allows for more precise test results.
Kinetic Perimetry
Kinetic perimetry is included as standard.
Fundus Oriented Perimetry
Static perimetry tests can be applied to areas of interest on fundus images taken from a retinal camera, OCT, or SLO.
Threshold test within the central 10°, custom optional threshold test that allows selection of any desired test points, and custom optional screening tests are available.
Threshold
In addition to central 30° used to observe the progression of glaucoma, other tests are available such as central 10° which can identify visual field abnormalities in the macula.
Analysis Indices
GHT (Glaucoma Hemifield Test)
For this index, threshold central test points are divided into 10 sectors, and corresponding sectors above and below the axis of the horizontal median are compared.
VFI (Visual Field Index)
A percentage index in which a normal visual field is 100% , and total loss of visual field is 0%
Anderson`s Criteria Diagnostic Support Function
This criteria is for glaucomatous visual field defect.
If any of the following conditions are satisfied, the colors turn orange.
- PSD has p<5%
- GHT is outside normal limits
- Pattern deviation probability plot shows a cluster of 3 or more nonedge points
that have p(The physician must judge whether the 3 points match the travel of NFL.)
Chronological Change Display
Test result analysis indices can be graphically displayed as time series data to give a clear grasp of changes over time in the tested eyes.
Predictive Display
Predictive graphs are displayed from calculations of linear rates of changes in analysis indices. This function predicts what values of MD and VFI will be reached at what age, if current rates of change in those values continue.
Convenient Tabbed User Interface
Main operation buttons are grouped at the top of the page, and buttons are laid out to follow the progression of tests, from patient information entry through test program selection to result display.
Screening
4-zone measurement that goes beyond screening, and programs using probability values (p-values), are among the features that enable effective testing in less time.
Running tests with probability value (p-value) intensities makes it possible to display the difference between the measured value and the normal value for each age range as a p-value, so that the evaluation equivalent to total deviation in thresholds can be performed in a shorter time.
Isopter
"Automatic measurement function", using many median patterns, "Manual measurement function", allowing free drawing of isopters, and "auto + manual measurement function", which allows any drawing of median after automatic measurement, are among the diverse measurement method options available.
Supported Languages
- English
- Chinese
- French
- German
- Italian
- Portuguese
- Russian
- Spanish
- Japanese
Structure and Function
Fundus Oriented Perimetry
Perform perimetry tests on fundus images
Integration of Structure and Function Provides a More Accurate Interpretation of VF Results
Decibels, deviation maps, probability plots can be integrated with your patients fundus images.
RGC displacement
Display with RGC displacement
Historical VF Results
Data from various threshold instruments can be imported. The imported tests ensure that your patients VF history is maintained.
Dimensions: 730 (W) x 430(D) x 700(H) mm
Weight: 26kg
Stimulus Presentation Method: Projection
Stimulus Color: White, Red, Blue Green
Stimulus Size: Goldmann I, II, III, IV, V
Maximum Stimulus Intensity: 3,183 cd/m² (10,000 asb): White
Stimulus Presentation Time: 0.2 Sec.
Stimulus Presentation Interval: 0.6-3.3 Sec. (Automatically Adjusted)
Background Intensity: White: 10cd/m² (31.5 asb) Yellow: 100 cd/m² (314.2 asb) (Automatic Light Adjustment)
Examination Distance: 300mm
Meaurement Range: 80°
External Interface: USB, Ethernet
Fixation Target: Orange LED Center: 1 Point, Auxiliary: 4 Point Fovea Examination: 4 Point
Eye Fixation Monitoring: Heijl Krakau Method, Eye Fixation Monitor, Gaze Monitor
Printout: USB-Connected Printer (sold seperately)
Operation Screen: Touch Panel Color LCD Monitor
Operation Support: Oral Instructions
Chin Rest Operation: Motor-driven
Screening Program: Standard, Precision, Center, Periphery, Glaucoma, V. Meridian, Center #1, Center #2
Screening Method: 2 Zone, 3 Zone, 4 Zone, Quantity Scotoma Intensity Step: 5dB/Probability Variable (p-value) Quick Mode Available
Supra Program: Standard, Macula, Mariotte, Optional, D-Test
Supra Method: Same Intensity as 2 Zone
Threshold Program: Center 1, Center 2, Meridian, Macula 2, Periphery
Threshold Method: All Threshold, Quick 2, Super Quick
Isopter Program: Standard, Isopter + Screening 1, Isopter + Screening 2, Isopter + Threshold
Isopter Method: Auto, Manual
Custom Program: Circle Threshold, 1 Point Threshold, Quadrant Threshold, Optional Threshold#, Optional Threshold◯, Screening#, Screening◯
Perimetry on Fundus: Perimetry Combined Fundus Image
Fovea Examination: Available in Threshold Center Examination (Threshold-Center 1, Center 2, Isopter + Threshold)
Analysis for Threshold Each Examination: Static Perimetry, Kinetic Perimetry, Blue-on-Yellow, Comparison to Age Related Normative Data, Four Color Stimulus: Red, Blue, Yellow, White, Golmann Size I-V Stimulus
Analysis for Threshold Chronological Changes: All Analysis Data: Scale, Threshold, Total Deviation p-value, Pattern Deviation p-value, Bebie Curve Graphically Displays: MD
Comparing: Comparison can be made between results of threshold screening or supra examination executed twice
Combination: Center, periphery, and isopter examinations can be combined in threshold and screening center examinations.
Display Both Eyes: Results of the examination of both eyes of the same patient executed on the same day are displayed side by side
Display Multi: Results of the examination executed four times (both eyes/either eye) of the same patient are displayed side by side
Database: Patient ID List Display, All List Display, Search Function, ID Extraction Function
Patient Information: ID, Name, Date of Birth, Sex, Correction, Visual Acuity, Diagnosis, Doctor, Comments
Data Save: Built-in Flash Memory, Capacity: For Approximately 20,000 Patients (40,000 Examinations
Normal Eye Database: Ver.1.0.0.0 Issued on 2011/06/09 Age Range: 20s to 70s Samples: 612 persons Criteria: Questioning, Visual Acuity, Reflection
Power Supply: Input: AC 100-230V 50/60 Hz Power Consumption: 200VA