
- Home
- Companies
- MtoZ Biolabs
- Services
- MtoZ Biolabs - KEGG Pathway Annotation ...
MtoZ Biolabs - Model kegg-pathway-and-enrichment-analysis -KEGG Pathway Annotation and Enrichment Analysis Service
KEGG (Kyoto Encyclopedia of Genes and Genomes) is a database used for systematic analysis of metabolic pathways and functions of gene products in cells. KEGG combines gene with its expression information as a whole network. KEGG records data from genome, chemical molecule, and biochemical system, including metabolic pathways (PATHWAY), drugs (DRUG), diseases (DISEASE), gene sequences (GENES), and genomes (GENOME).
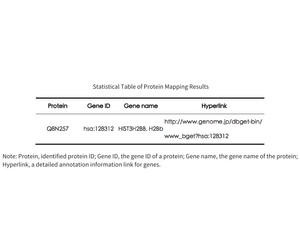
1. Statistics of KEGG Mapping Results for All Identified Proteins
Table 1. Statistical Table of Protein Mapping Results
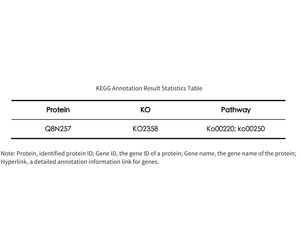
Table 2. KEGG Annotation Result Statistics Table
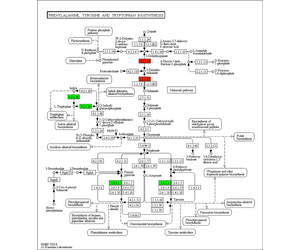
In organism, different gene products coordinate to exercise biological functions. Pathway annotation analysis of differentially expressed genes helps to further understand the functions of genes. Pathway annotation diagram for differentially expressed proteins is as follows:
Figure 1. Pathway Diagram of KEGG Annotation Results
Note: Compared to the control group, enzymes marked in red are related to upregulated proteins; enzymes marked in green are related to downregulated proteins; enzymes marked in blue are related to both upregulated and downregulated proteins. The numbers inside the boxes represent the number of enzyme (EC number), and the entire pathway consists of complex biochemical reactions catalyzed by various enzymes. This pathway diagram marks enzymes related to differentially expressed genes in different colors, which focuses on the study of the differential expression of certain metabolic pathway-related proteins according to the difference among subjects and explains the root causes of phenotypic differences through the pathway.
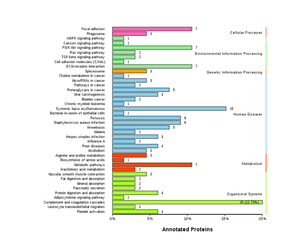
The annotation results of differentially expressed genes in KEGG are classified according to the pathway types in KEGG, results are shown in the following figure:
Note: The vertical axis is the name of the KEGG metabolic pathway, and the horizontal axis represents the number of proteins annotated to that pathway and their proportion of the total annotated proteins.
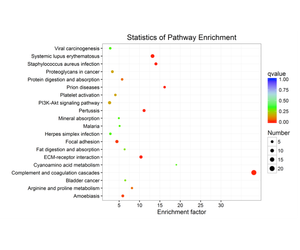
Analysis of whether differentially expressed proteins are over-represented in a certain pathway is termed pathway enrichment analysis for differentially expressed proteins. We use Kobas software to perform KEGG pathway enrichment analysis for differentially expressed proteins. The results of the KEGG pathway enrichment analysis for differentially expressed proteins are shown in the following figure:
Note: Each point in the diagram represents a KEGG pathway, with the pathway name on the left axis. The horizontal axis represents the enrichment factor, a ratio that the proportion of differentially expressed proteins annotated to the pathway to the proportion of proteins in that species annotated to a pathway. The higher the enrichment factor, the more reliable the significance of enrichment of differentially expressed proteins in that pathway.
MtoZ Biolabs is an integrate contract research organization (CRO) providing advanced proteomics, metabolomics, bioinformatics, and biopharmaceutical analysis services to researchers in biochemistry, biotechnology, and biopharmaceutical fields. The name of MtoZ represents “mass to charge ratio” in mass spectrometry analysis, as most of our services are provided based on our well-established mass spectrometry platforms. Our services allow for the rapid and efficient development of research projects, including protein analysis, proteomics, and metabolomics programs.
MtoZ Biolabs is specialized in quantitative multiplexed proteomics and metabolomics applications through the establishment of state-of-the-art mass spectrometry platforms, coupled with high-performance liquid chromatography technology. We are committed to developing efficient, and effective tools for addressing core bioinformatics problems. With a continuing focus on quality, MtoZ Biolabs is well equipped to help you with your needs in proteomics, metabolomics, bioinformatics, and biopharmaceutical research. Our ultimate aim is to provide more rapid, high-throughput, and cost-effective analysis, with exceptional data quality and minimal sample.
Email: marketing@mtoz-biolabs.com